Blog · Case study
AI Agents in the Enterprise: Building Smarter ERP Dashboards with Purpose-Built Tools
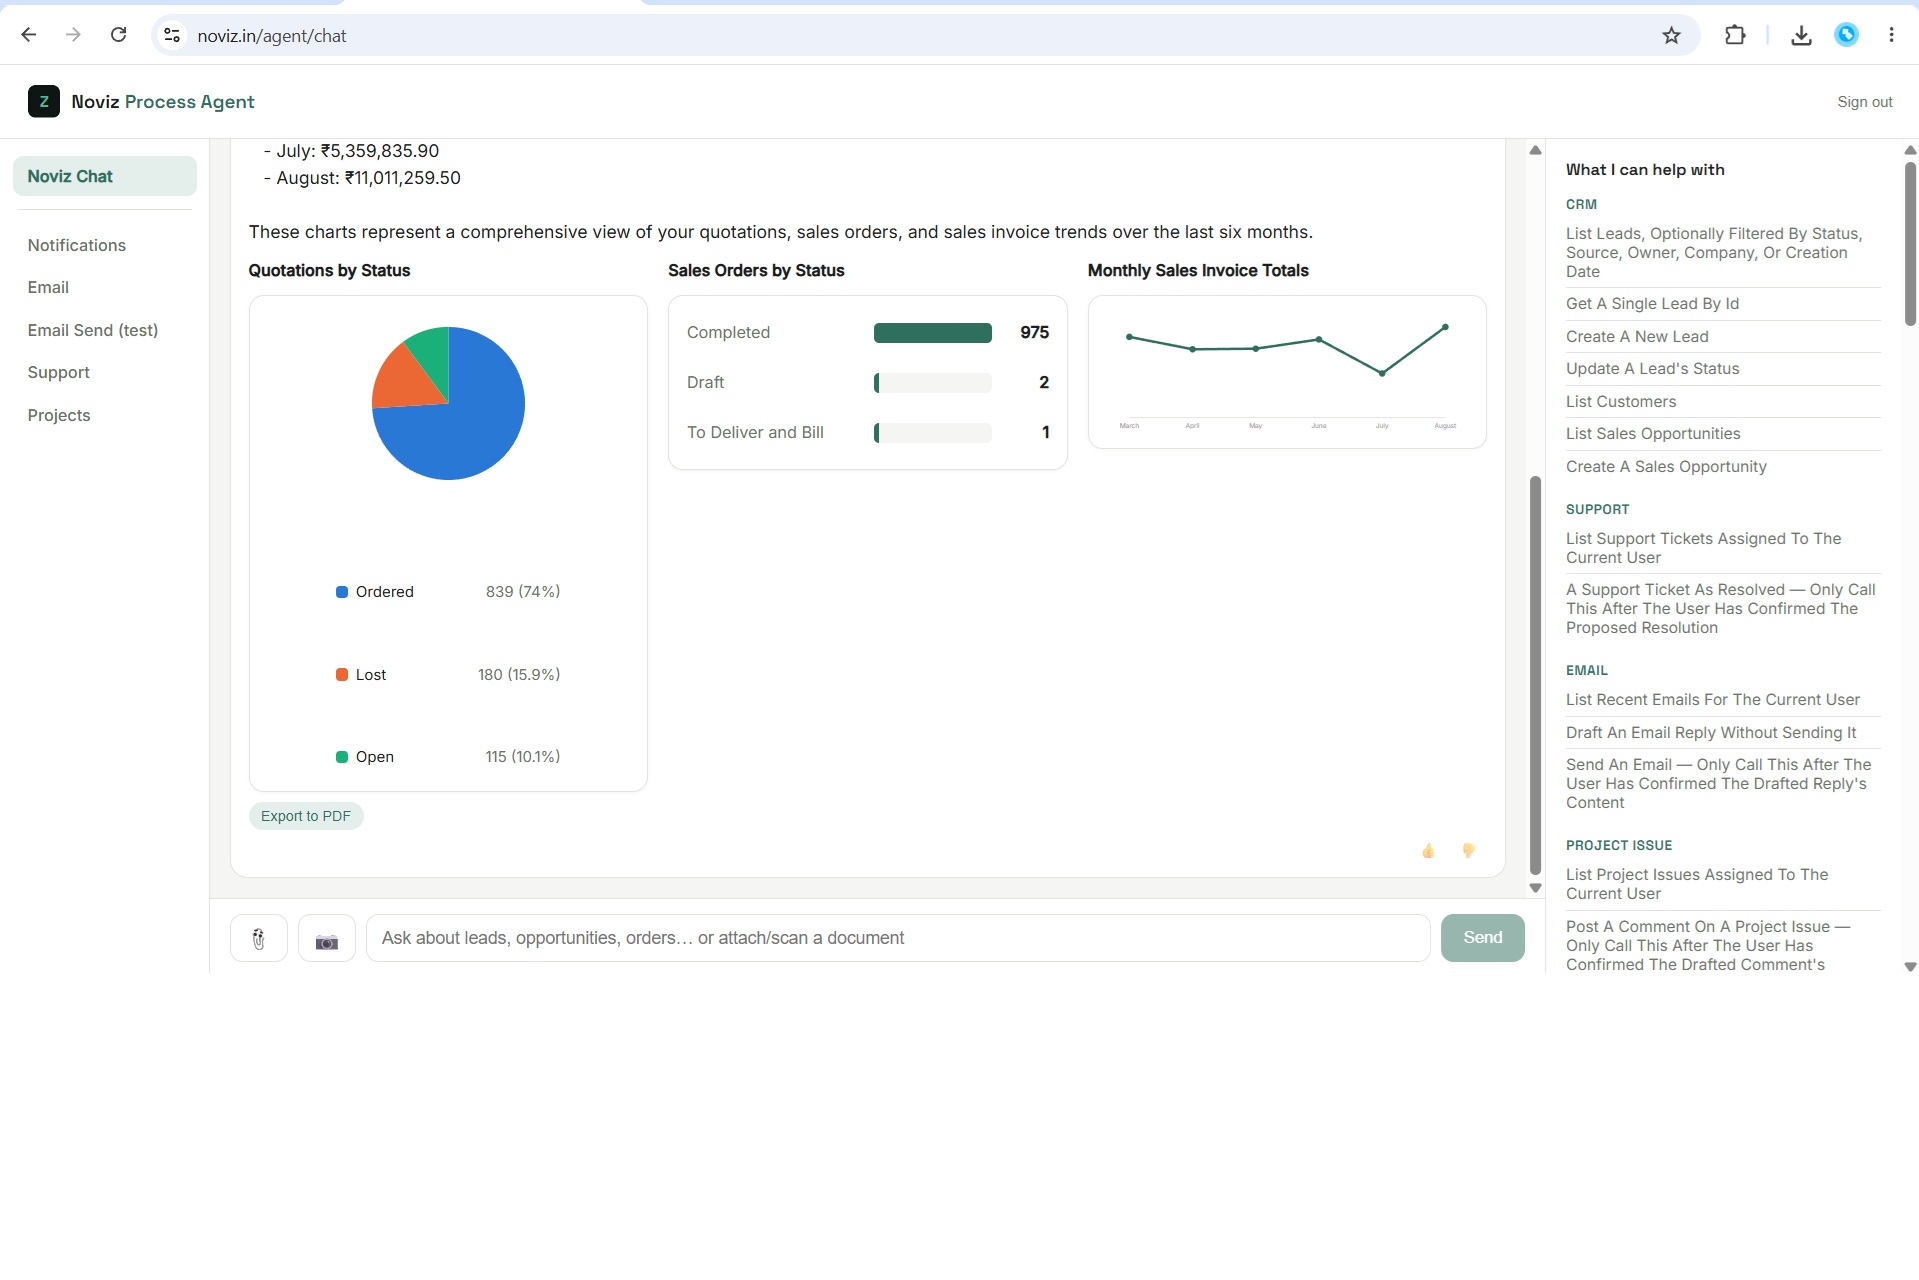
A field note from building Noviz's own chart-generation pipeline: instead of letting a single model call invent both the numbers and the picture at once, the work is split across three composable, purpose-built tools — one to fetch exact data, one to shape it into a validated chart spec, and one to render it — with the model only ever orchestrating them, never computing or drawing anything itself. The result: ask for "a sales dashboard with a pie chart, a bar chart, and a trend line" in one sentence, and it plans and builds all three, composed into a single combined dashboard.